Data Segmentation Profile Effects in CatWalk XT
Using the Data Segmentation Profile, or accidentally selecting it, can cause footprints that have been classified to be excluded from visualizations and statistics. This can lead to confusion if you're not aware that it's active.
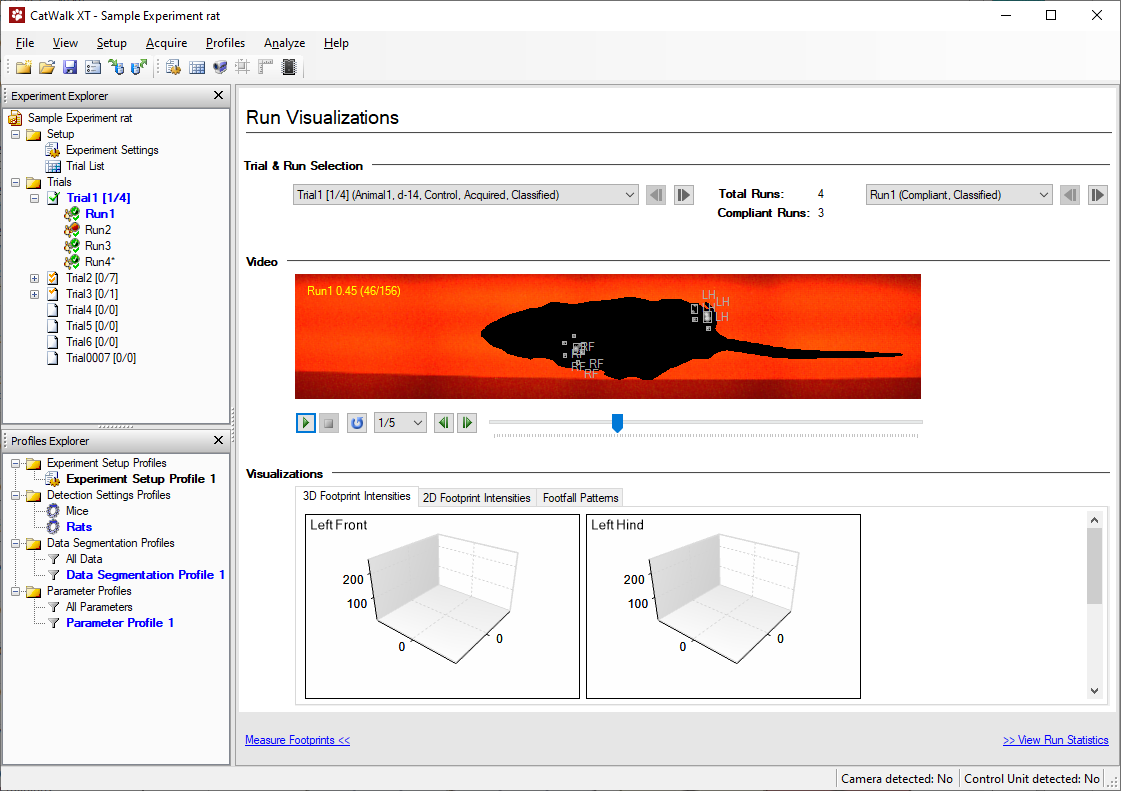
Filtered-out results may appear as follows in the Run Visualizations:
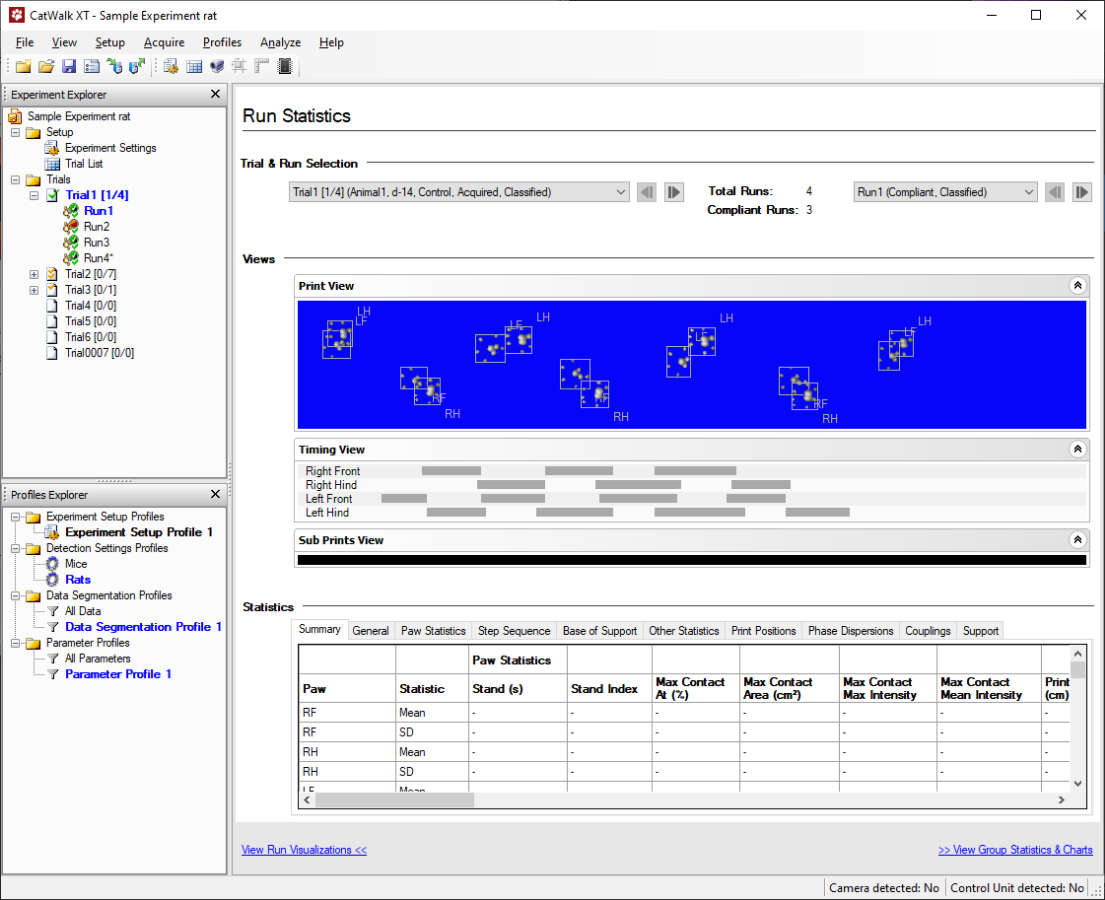
And in the Run Statistics:
What Causes This?
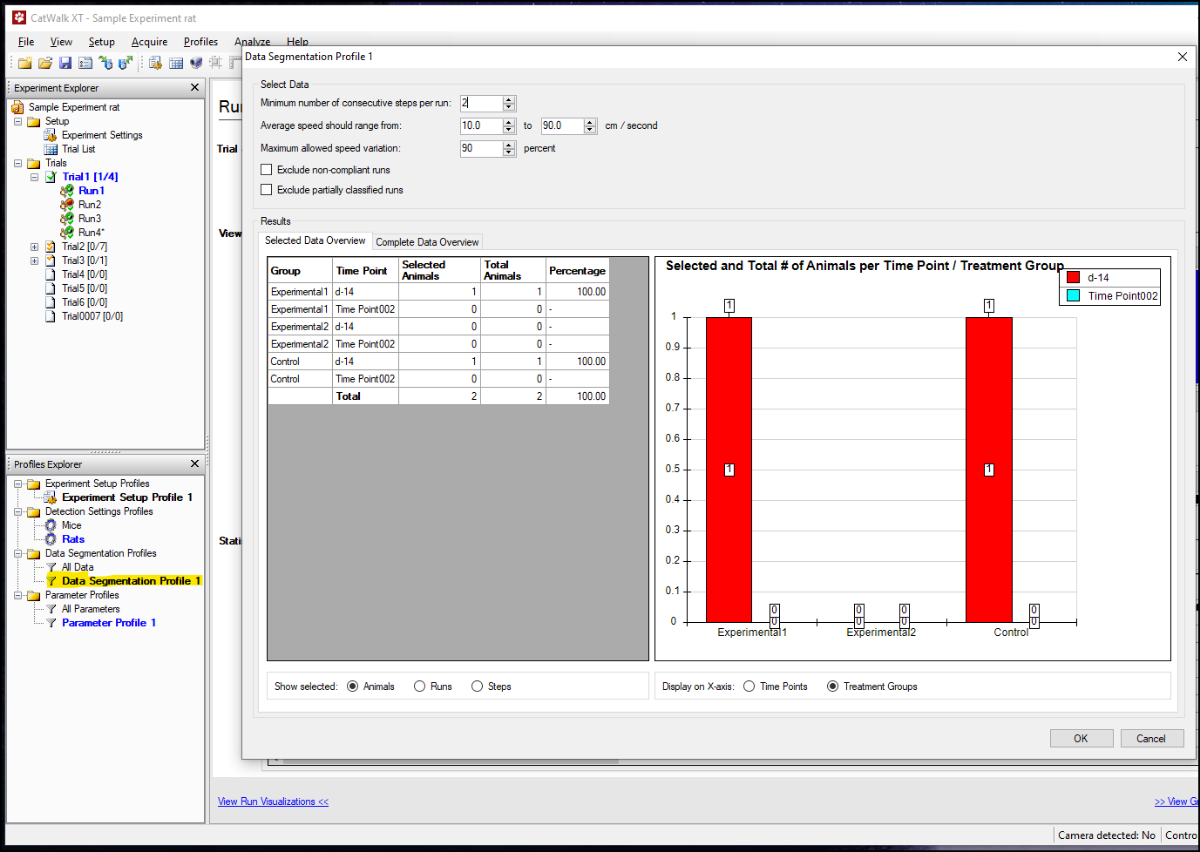
At the bottom left of the CatWalk interface, under Profiles Explorer, there is a section labeled Data Segmentation Profile. By default, All data is the active profile and will show all collected data.
If a different profile is active, such as Data Segmentation Profile 1 or another custom profile, then only data that matches its criteria (e.g., speed, duration) will be shown. This can lead to footprints being grayed out or missing from the results.
How to Fix It
If you encounter missing or grayed-out results, you can fix this in one of two ways:
- Reactivate the “All data” profile: Double-click All data, or right-click it and choose Set as active.
- Modify the segmentation settings: If you want to use a segmentation profile but are missing data, adjust its filters (e.g., duration, speed) to be less restrictive.
Using segmentation profiles is useful for specific analysis, such as evaluating gait at specific speeds, but it’s important to ensure the correct profile is selected for your analysis goals.