Overview of Activity, Mobility, and Movement
EthoVision provides several dependent variables to measure different aspects of animal behavior. Activity, Mobility, and Movement each quantify how much time the animal is moving versus being stationary.
These measures can be used to analyze behavior such as:
- Sleep – prolonged inactivity
- Freezing – brief inactivity
- Seizures – brief bursts of intense activity
Each measure has a:
- Continuous measure – a value recorded at every sample point
- State measure – a classification based on thresholds
Examples:
- Activity (continuous) and Activity State (state)
- Mobility and Mobility State
- Movement is a state derived from Velocity
Mobility
Mobility looks at the entire yellow-highlighted area detected as the animal. It measures the percentage of that area that is different between two sample points. Mobility may be high due to translational movement or body shape changes like turning in place.
Mobility = % change between A(n-1) and A(n), where A = animal's detected area. CA(n) is the calculated changed area.

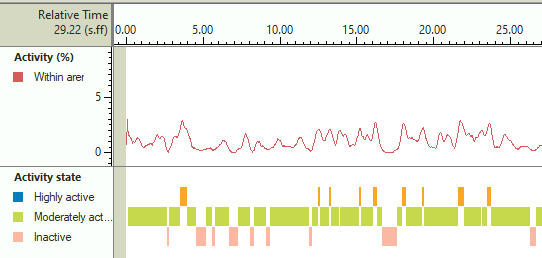
Mobility States categorize the mobility percentage using thresholds:
- Immobile: below 4%
- Mobile: 4–10%
- Highly mobile: above 10%

Activity
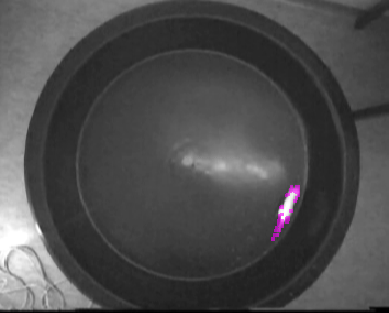
Activity measures change in the entire arena, not just what’s detected as the animal. It tracks the percentage of changing pixels compared to the previous frame. Shadows or reflections may contribute.
Activity States categorize change percentages using thresholds, just like Mobility States.
When to use Activity:
- Whole-body detection is inconsistent
- Shadows/reflections interfere with Mobility
- Tracking isn’t possible (e.g., too many animals)
To enable Activity:
- Enable Activity in Experiment Settings
- Click Activity in Detection Settings
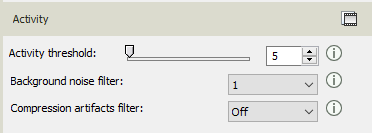
Settings:
- Compression Artifacts Filter: On for video files, Off for live tracking
- Background Noise Filter: Use if noise appears across the arena
- Activity Threshold: Adjust to show movement (purple) without false detections
Movement
Movement measures whether the animal’s center point is moving faster than a velocity threshold. It is a binary state—either moving or not moving.
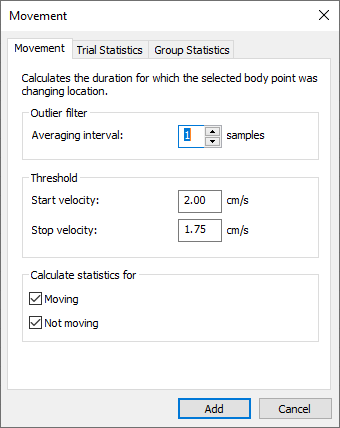
Example thresholds:
- Moving: ≥ 2.00 cm/s
- Not moving: ≤ 1.75 cm/s
Limitations: Movement does not distinguish between still but active behavior (e.g., grooming) and complete inactivity (e.g., sleep).
Determining Thresholds
State-based measures require appropriate thresholds. Use the Integrated Visualization to identify optimal values:
- Add Velocity, Mobility, and Activity to your analysis profile
- Open the Integrated Visualization to see video, tracking, and data plots
- Use zoom and hover to examine specific behaviors
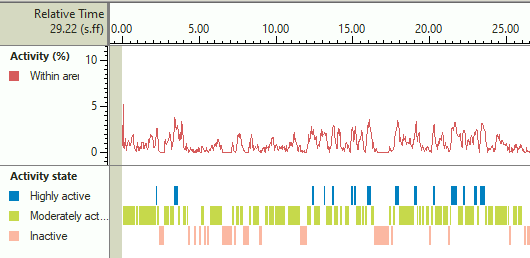
If the data is noisy, increase the Averaging Interval (e.g., 10 samples) for smoother results:
Use behavioral periods (e.g., freezing, seizures) to guide threshold selection. Then configure Movement, Mobility States, and Activity States accordingly.
Be sure to match averaging intervals between continuous and state variables. Use the integrated visualization to refine thresholds. You can also exclude brief intervals (e.g., under 1 second) for Activity States if they are irrelevant to your analysis (e.g., sleeping).