Calculating Dependent Variables by Zone
EthoVision XT allows you to analyze any dependent variable (DV) per zone. For instance, in a Morris Water Maze study, you can calculate the Distance Moved within each quadrant to understand how much of the total path occurred in each region.
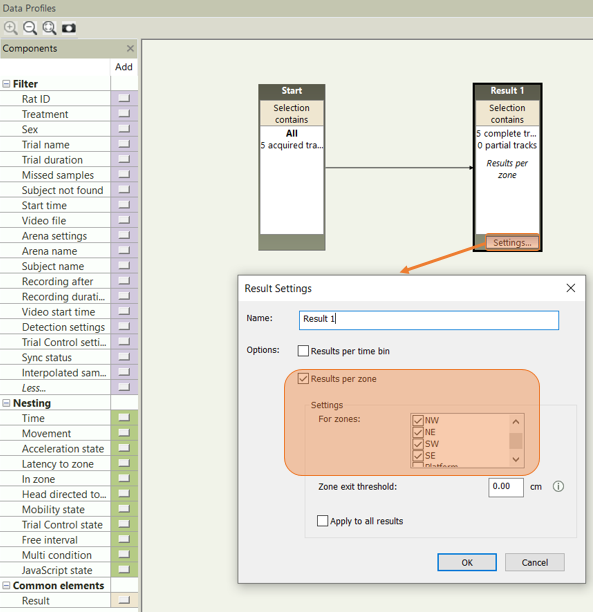
Step 1: Enable "Results per zone" in the Data Profile
In your Data Profile, click the Settings button on the Result(s) container, then:
- Check the box for Results per zone.
- Select the specific zone(s) for which you want to analyze dependent variables.
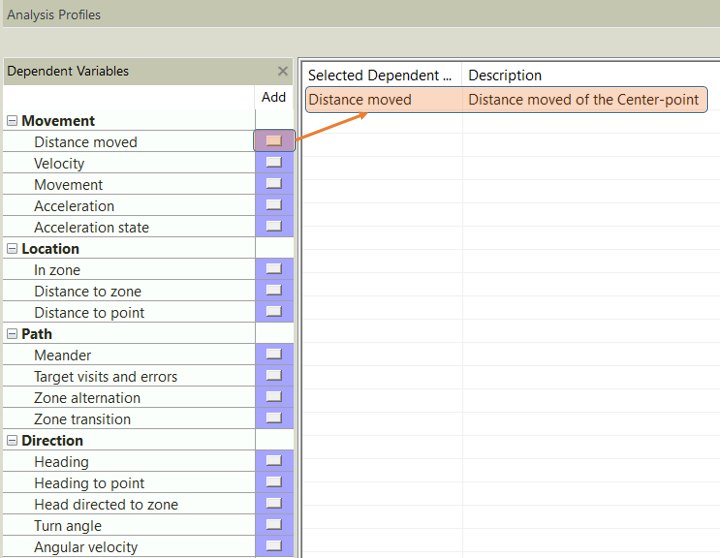
Step 2: Add Dependent Measures in the Analysis Profile
- Distance moved
- Velocity
- Time spent
Step 3: View Zone-Specific Data in Statistics & Charts
Open the Statistics & Charts section. You will now see the selected dependent variables broken down by the zones you enabled in the Data Profile.
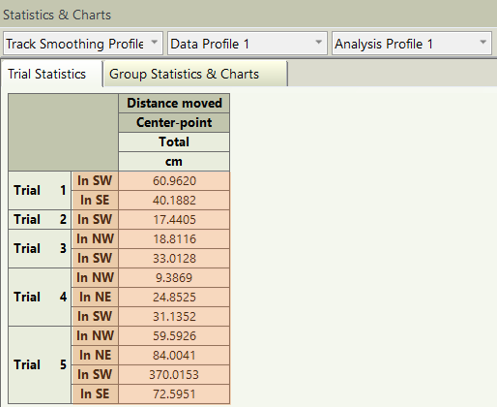
This approach is especially useful in spatial navigation tasks or when analyzing zone preferences across experimental conditions.